.png)
ProSight Measure for Smarter Industrial Monitoring and Sustainability
A sensor is only useful when people can understand what it is saying. Across factories, water networks, waste facilities, mines, farms, and energy assets, teams now collect data from pumps, tanks, meters, weather stations, emissions monitors, vibration sensors, and water quality probes. The challenge is no longer whether data exists. The challenge is turning that data into timely decisions.
ProSight Measure is built for that gap. It brings industrial and environmental sensor data into one clear dashboard, so teams can monitor conditions as they change, respond faster, and maintain better control over compliance and performance.
For operations teams, this can mean fewer blind spots. For sustainability teams, it can mean clearer evidence for reporting. For managers, it can mean decisions based on what is happening now, not what happened last week.

Why industrial monitoring needs a better dashboard
Many sites already use sensors, but the data often sits in separate systems. A maintenance team may check vibration readings in one tool, an environmental officer may download water quality logs from another, and an operations manager may rely on spreadsheets that arrive after the fact.
That split creates common problems:
Delayed response to faults and threshold breaches
Manual reporting work that takes time and invites errors
Limited visibility across remote assets
Data gaps that make compliance harder to prove
Decisions based on incomplete or outdated information
ProSight Measure addresses these issues by putting sensor information in one place. Instead of switching between devices, portals, files, and email alerts, users can see live and historical data through a central view.
The value is practical. If a pH sensor begins trending towards a licence limit, a team can see it before it becomes a breach. If a pump draws more current than usual, maintenance can inspect it before failure. If temperature, humidity, dust, noise, or water levels change at a remote site, staff can respond without waiting for the next site visit.
That kind of visibility supports both productivity and sustainability. It helps teams reduce waste, prevent avoidable downtime, and keep better records.
Real-time monitoring turns sensor data into decisions
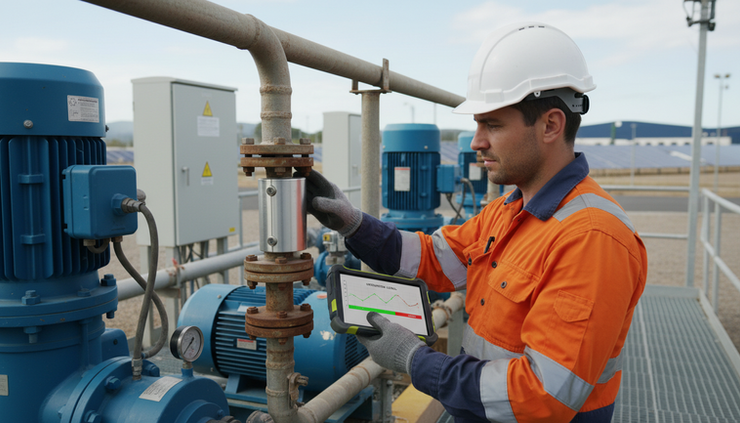
The core strength of ProSight Measure is real-time data monitoring. Sensors keep watch over changing conditions, while the dashboard presents readings in a format people can use.
Real-time monitoring matters because industrial and environmental conditions can change quickly. A tank can overflow after heavy rain. Turbidity can spike during earthworks. A refrigeration unit can drift outside its set range. A motor can overheat in the middle of a shift.
When teams only review data at the end of the day, they may find problems after the damage is done. Live monitoring shortens that gap.
ProSight Measure can support several types of sensor data, depending on the site setup:
Sensor category | Common readings | Typical use |
Water quality | pH, turbidity, conductivity, dissolved oxygen, temperature | Wastewater, stormwater, aquaculture, environmental monitoring |
Industrial equipment | vibration, pressure, flow, current, temperature | Maintenance, production control, asset health |
Air and emissions | particulates, gases, odour indicators, wind speed and direction | Site boundary monitoring, process control, compliance |
Energy and utilities | electricity, gas, steam, compressed air, water use | Efficiency tracking, cost control, sustainability reporting |
Weather and site conditions | rainfall, humidity, temperature, wind, solar radiation | Mining, agriculture, construction, water management |
The dashboard can show current readings, trends over time, and threshold status. A single abnormal reading may not mean much by itself, but a trend can reveal a developing issue. For example, a slow rise in pump vibration may point to bearing wear. A repeated spike in water use after hours may reveal a leak or process fault.
Good monitoring does not just display numbers. It helps users spot patterns early.
Alerts help teams act before issues escalate
Live dashboards become more useful when they support alerts. ProSight Measure can be configured around site limits, equipment tolerances, operating ranges, or environmental licence conditions.
A well-designed alert system does three things:
Shows what changed
Shows where it happened
Gives enough context for the next action
For example, an alert for high turbidity in discharge water should not simply say, “high reading”. It should identify the sensor, location, time, threshold, current value, and trend. If the reading followed a rainfall event, that context can help staff respond with the right controls.
Alert fatigue is a real problem in many monitoring systems. If every small fluctuation triggers a message, users stop paying attention. ProSight Measure is most useful when alert rules match operational risk. Some readings need immediate escalation. Others may only need a daily review or trend check.
The best setups use tiers, such as:
Advisory alerts for early movement outside a preferred range
Warning alerts near a critical limit
Critical alerts when action is required straight away
This keeps the dashboard useful without turning it into noise.

A user-friendly interface makes data easier to trust
Industrial software often fails when it expects every user to be a data analyst. Field staff, supervisors, compliance officers, engineers, and managers all need different levels of detail. A user-friendly interface matters because it lets each person find what they need without extra training or guesswork.
ProSight Measure presents sensor data through visual dashboards, charts, maps, status indicators, and reports. The goal is not to decorate the data. The goal is to make the current state of the site clear.
A good interface supports quick answers to common questions:
Is the site operating within normal limits?
Which assets need attention?
Did the issue start suddenly or build over time?
Are readings missing from any sensors?
What happened before and after an alarm?
Can the data be exported for reporting or investigation?
For a maintenance technician, the most useful view may show equipment health and alarms. For an environmental manager, it may show discharge quality, rainfall, wind direction, and licence limits. For an operations lead, it may show site-wide status at a glance.
Role-based views make this more manageable. Instead of forcing everyone into the same screen, the dashboard can present the right level of detail for the task.
Historical views are just as valuable. A live reading shows what is happening now. A trend line shows whether the current reading is normal, unusual, or part of a recurring pattern. That is where teams begin to move from reaction to prevention.
Integration keeps sensor systems connected
Industrial and environmental monitoring rarely starts from a blank slate. Most sites already have installed sensors, programmable logic controllers, supervisory control and data acquisition systems, laboratory records, spreadsheets, and reporting processes.
ProSight Measure is most effective when it connects with these existing tools rather than replacing everything at once. Integration capabilities allow the dashboard to bring together data from varied sources, such as:
Industrial sensors and meters
Remote telemetry units
SCADA and control systems
IoT gateways
Laboratory information systems
Weather services
Data historians
Reporting and analytics tools
This matters because a single reading often needs context. A spike in discharge turbidity may relate to rainfall. Higher energy use may relate to production volume. A vibration alarm may relate to a change in process load.
When systems connect, teams can compare these signals in one place. That leads to better decisions.
Integration also protects past investment. Many industrial sensors are expensive, and some operate in harsh environments for years. A dashboard should not require every device to be replaced before value appears. It should support staged improvement, where teams connect priority assets first, then expand over time.
Security and governance also matter. Sensor data can reveal operational patterns, equipment status, or environmental performance. Access controls, clear permissions, and reliable data handling help maintain trust in the system.
Better decisions come from clearer evidence
The main benefit of ProSight Measure is not the dashboard itself. The benefit is better decision-making.
When leadership can see current performance and trend history, conversations change. Instead of asking, “What do we think is happening?”, teams can ask, “What does the data show, and what should we do next?”
This supports practical decisions across the site.
Maintenance teams can move from fixed schedules to condition-based work. If a motor runs normally, it may not need early intervention. If vibration or temperature trends rise, staff can inspect it before failure.
Operations teams can tune processes based on live feedback. If flow rates, tank levels, or pressure readings shift outside the usual range, they can adjust before throughput or quality suffers.
Sustainability teams can track resource use with more confidence. Water, energy, waste, and emissions-related data become easier to review, compare, and report.
Compliance teams can maintain clearer records. Instead of searching for spreadsheets and manual logs, they can use consistent sensor records with timestamps and trend history.
Good data does not make decisions on its own. It gives people a better starting point.
Efficiency improves when teams spend less time chasing data
Manual monitoring can be expensive in hidden ways. Staff drive to remote sites to check meters. Operators copy readings into spreadsheets. Reports take hours to prepare. Maintenance teams investigate faults after alarms, not before them.
ProSight Measure can reduce that wasted effort by centralising sensor readings and flagging changes early.
The efficiency gains often appear in several areas:
Area | Before connected monitoring | After dashboard-based monitoring |
Site checks | Routine visits to read instruments | Remote review with targeted site visits |
Reporting | Manual data entry and spreadsheet work | Exportable records and trend views |
Maintenance | Reactive repairs after breakdowns | Earlier inspection based on sensor trends |
Compliance | Scattered logs and manual evidence gathering | Clear records tied to time and location |
Operations | Decisions based on partial updates | Shared view of current site conditions |
These gains do not always come from large changes. Sometimes the biggest improvement is simple. Everyone looks at the same version of the truth.
When operators, technicians, and compliance staff work from the same data, they spend less time reconciling conflicting records and more time solving the issue.
Environmental compliance becomes easier to manage
Environmental compliance depends on proof. Regulators, licence holders, and communities all need confidence that sites understand their impact and control their risks.
For Australian organisations, compliance duties can vary by state, industry, licence condition, and site activity. Monitoring may involve water discharge, air quality, waste storage, dust, noise, odour, groundwater, or resource use. Manual records can still play a role, but sensor dashboards make it easier to manage evidence over time.
ProSight Measure supports compliance by helping teams:
Track readings against approved limits
Record when and where thresholds are exceeded
Review trends before reporting periods
Link environmental conditions with site activity
Export data for internal review
Identify gaps in sensor coverage or data quality
This is useful for formal reporting, but it also supports better day-to-day control. If a site sees a pattern of rising dust levels during certain wind conditions, it can adjust work practices. If wastewater readings move near a limit after heavy rain, staff can investigate inflow and storage capacity.
Environmental management improves when teams see early signals, not just final results.
Examples of successful implementations
The following examples are anonymised and based on common industrial and environmental monitoring patterns. They show how a dashboard like ProSight Measure can change daily operations.
A water utility reduces after-hours callouts
A regional water utility operated several small treatment sites across a wide area. Staff relied on local alarms, periodic site visits, and manual checks. After heavy rain, operators often needed to inspect assets after hours because they lacked confidence in remote readings.
The utility connected flow, level, rainfall, and water quality sensors into a central dashboard. Operators could see which sites needed attention and which were stable. Alerts were set for rising tank levels, abnormal flow, and water quality thresholds.
The result was a more focused response. Staff still visited sites when needed, but they no longer treated every weather event as a full inspection round. The dashboard helped separate genuine risk from normal variation.
A food manufacturer improves energy and water control
A food processing site wanted better visibility of water and energy use across production lines. The site already had meters, but readings were reviewed after production runs. That made it hard to find waste during the shift.
By connecting meters to ProSight Measure, supervisors could compare use by line, time, and process stage. When water use rose outside the usual range, the team investigated during production instead of waiting for a monthly review.
The site used the data to support maintenance checks, staff training, and process changes. The biggest value came from timing. Problems became visible while there was still time to act.
A construction project improves boundary monitoring
A large construction site needed to monitor dust, noise, weather, and runoff risk near sensitive boundaries. Before the dashboard, environmental staff collected data from separate devices and prepared summary reports manually.
The project connected boundary sensors, rainfall data, and water quality points into one view. Alerts helped the team respond when conditions increased risk, such as dry wind during earthworks or heavy rain near exposed soil.
This gave the project team clearer records and faster response times. It also helped site leaders discuss environmental controls with contractors using shared evidence.
A remote mining operation tracks water and equipment risk
A remote mining operation used sensors across dewatering systems, storage ponds, pumps, and weather stations. Distance made manual checks slow and costly. Separate data sources made it hard to see the full picture.
With a central dashboard, operators could review pump status, water levels, rainfall, and key environmental readings together. Maintenance teams used trend data to plan inspections, while environmental staff reviewed discharge-related data before reporting periods.
The result was better coordination between operations and compliance. The site could see operational risk and environmental risk side by side.
What to look for in a sensor dashboard
A dashboard should do more than collect readings. It should make monitoring easier to manage over the long term.
When assessing a platform like ProSight Measure, teams should look for:
Clear live views
Users should see site status quickly, without hunting through menus.
Reliable alerts
Alert rules should match real operational limits and avoid unnecessary noise.
Flexible integrations
The system should connect with current sensors, gateways, and reporting tools where possible.
Historical trends
Users need to review patterns over hours, days, months, and seasons.
Data quality checks
Missing readings, flatlined sensors, and unusual spikes should be easy to spot.
Export and reporting options
Teams should be able to prepare evidence for audits, reviews, and compliance reporting.
Scalable setup
A site may start with a few high-risk assets and expand to a wider network later.
The right dashboard should fit how the site works. If it creates extra administration, people will avoid it. If it makes work clearer, they will use it.

The sustainability value is practical, not abstract
Sustainability programs often fail when they stay too far from daily operations. Targets and reports matter, but site teams need tools that help them control real systems.
ProSight Measure supports sustainability by connecting resource use, environmental indicators, and asset performance. That connection helps teams find waste, prevent avoidable incidents, and build a clearer record of progress.
A factory can see where compressed air or water use rises unexpectedly. A utility can track overflow risk before a storm becomes a crisis. A mine can compare rainfall, water storage, and discharge conditions. A council can monitor environmental assets across a large service area without sending staff out for every check.
The pattern is the same across sectors. Better visibility leads to better control, and better control supports lower risk.
Smarter monitoring starts with clearer data
Industrial and environmental sensors already play a key role in safer, cleaner, and more efficient operations. The next step is making their data easier to use.
ProSight Measure for Smarter Industrial Monitoring and Sustainability brings live readings, alerts, trends, and integrations into one practical dashboard. It helps teams respond sooner, work with shared evidence, and manage compliance with more confidence.
For organisations balancing productivity with environmental responsibility, that matters. A good dashboard does not replace skilled people. It gives them the timely information they need to protect assets, improve performance, and make sustainability part of everyday operations.


