
Soil Moisture Monitoring Irrigation Decisions for Better Crop Management
A soil moisture graph can look precise and still point to the wrong decision. If the probe sits in a convenient patch near a gate, beside a leak, or in a soil type that does not match the rest of the paddock, the data may describe that one spot well and the managed crop poorly.
Good irrigation decisions come from trends that reflect the crop’s root zone, the irrigation system, and the weather the crop has just experienced. The value is not only in knowing whether the soil is “wet” or “dry” today. It is in seeing how quickly the crop is using water, how deeply irrigation is moving, and whether the next irrigation should be brought forward, delayed, shortened, or extended.
That is why soil moisture monitoring irrigation should start with a field layout plan, not with the nearest easy installation point.
Soil moisture trends are more useful than single readings
A single reading can help, but the trend usually tells the better story.
Soil moisture moves because of several forces:
Plant water use
Evaporation from the soil surface
Irrigation or rainfall
Drainage below the measured layer
Soil texture and structure
Root depth and crop stage
A number on its own cannot explain which of these forces is driving the result. A trend can show the pattern.
For example, after irrigation, a shallow sensor may show a fast increase. If the deeper sensor barely changes, the applied water may not have reached the active root zone. That can matter in a crop with deeper roots, especially during hot weather. By contrast, if deeper readings rise strongly and stay high for a long period, the irrigation may have pushed water below where the crop can use it.
Trends also help separate normal daily crop water use from a developing problem. A steady daytime decline followed by a plateau at night may be normal. A faster than usual decline during a hot spell may signal higher crop demand. A flat line during a period when crop use should be active may point to poor sensor contact, logging issues, saturated conditions, or a crop with limited root activity in that layer.
The best use of monitoring is not to chase every wiggle in the graph. It is to learn the normal pattern for a crop, soil, and irrigation set-up, then adjust when the pattern changes.
Build the layout around management zones
The first question is not “Where can the probe go?” The better question is “Which parts of the farm are managed differently, or behave differently?”
A management zone is an area where irrigation decisions should reasonably be based on similar conditions. The boundaries may not match paddock boundaries. They may follow changes in soil type, slope, sprinkler performance, drip line layout, crop vigour, salinity risk, or drainage.
Common differences include:
Soil texture
Sandy soils wet and dry faster than heavier clay soils. A probe in lighter soil may suggest irrigation is needed before the heavier parts of the block require it.
Slope and drainage
Higher areas can dry sooner. Lower areas may stay wetter after rainfall or irrigation.
Irrigation layout
Pressure variation, emitter spacing, sprinkler overlap, and block design can all affect how evenly water reaches the crop.
Crop condition
A high-vigour area may use water faster than a weaker area. A stressed or patchy crop may not represent the main production zone.
Rooting depth
Young crops, established trees, annual vegetables, and broadacre crops all draw water differently through the profile.
The aim is not to put a sensor everywhere. The aim is to place a practical number of probes where they explain the areas that matter most. For many farms, that means starting with the most important crop type or irrigation block, then adding monitoring points as the data shows where variation is too large to ignore.
A convenient installation point can still be a good location, but only if it represents the zone. If the spot is easier because it is close to a track, gateway, fence, water point, or communications access, check that it still matches the managed area.
A clear graph from the wrong place is worse than a rougher graph from the right place because it can give false confidence.
Match probe depth to the active root zone
Soil moisture monitoring works best when the measured depth relates to where the crop is actually taking up water.
Shallow measurements are useful because they show recent rainfall, surface evaporation, and whether irrigation has wetted the topsoil. They can also explain seedling establishment and early crop stress. The limit is that shallow data may overstate the value of small rainfall events if roots are using water from deeper layers.
Deeper measurements help show whether irrigation or rainfall is reaching the crop’s main root zone. They also show whether water is draining beyond the effective root area.
For many crops, it helps to monitor more than one depth. The pattern across depths can answer practical questions:
Pattern in the trend | What it may suggest |
Shallow layer rises, deeper layer does not | Water may not be reaching deeper active roots |
Shallow and mid layers rise, deep layer stays stable | Irrigation may be refilling the useful zone without excess drainage |
Deep layer rises strongly after irrigation | Water may be moving below the main uptake area |
All layers decline quickly | Crop demand may be high, or the soil may have low water-holding capacity |
Readings stay flat despite irrigation | Sensor contact, installation, or system operation should be checked |
These patterns are guides, not automatic rules. Soil type changes how fast water moves. Clay soils can wet unevenly. Sandy soils can change quickly. Cracking soils, stones, compaction, and organic matter can all affect readings.
The right depth also changes through the season. A shallow-rooted young crop may need close attention near the surface. A mature crop may need data from deeper layers to avoid under-irrigating during peak demand.
For tree crops and vines, root distribution can vary with emitter placement, row structure, soil constraints, and management history. A probe installed too far from the wetting pattern may miss the water being applied. One placed too close to an emitter may overstate the water available to the broader root system.
Install sensors so the soil reading is trustworthy
Poor installation can make a good sensor look unreliable.
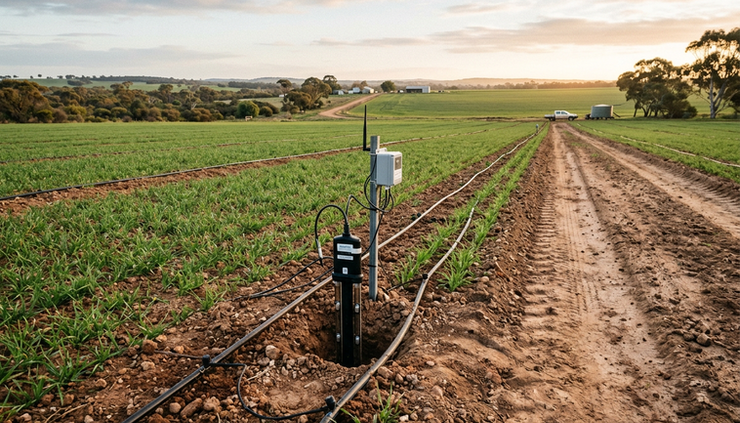
Soil moisture probes need suitable contact with the surrounding soil. Air gaps, smeared soil, loose backfill, rocks, and disturbed structure can all affect readings. A sensor that does not sit firmly in natural soil may respond differently from the crop root zone.
Good installation practice usually includes:
Choosing a location that represents the zone
Avoiding wheel tracks, headlands, leaks, block edges, and unusual crop patches
Installing at the correct depth and orientation for the selected probe
Ensuring firm contact between the probe and soil
Following the manufacturer’s instructions for backfilling and settling
Recording the exact location, depth, crop stage, and soil conditions at installation
It also helps to take photos and notes at the time of installation. Later, when a graph looks unusual, those notes can save guesswork. Was the probe in a heavier soil patch? Was the crop newly planted? Was the irrigation system being repaired nearby? Was the installation close to a line, sprinkler, or wetter part of the row?
Sensor readings are easier to trust when they match what is seen in the field. If the data suggests dry soil but a hand inspection shows wet soil at the measured depth, investigate before changing irrigation. The issue may be installation, calibration, soil contact, or interpretation.

Read soil moisture beside weather and irrigation events
Soil moisture data becomes more useful when it is read with weather and irrigation history.
A drop in soil moisture during a mild week may mean something different from the same drop during hot, dry, windy conditions. Rainfall may wet the surface but not the deeper root zone. A cool, cloudy period may reduce water use enough to delay irrigation.
Useful context includes:
Recent irrigation start and finish times
Irrigation duration and applied depth where known
Rainfall timing and amount
Temperature
Wind and humidity
Crop growth stage
Recent cultivation or soil disturbance
Fertigation events, if relevant
System issues such as blocked filters, broken emitters, or pressure changes
Temperature readings can add practical context. Soil temperature affects root activity, germination, and crop growth. It can also help explain why soil moisture trends look different in cooler or warmer periods.
The most useful habit is to mark irrigation and rainfall events against the soil moisture trend. When the graph rises, the event history should explain why. When it does not rise after irrigation, the reason may be shallow wetting, poor distribution, sensor placement, communications issues, or a system fault.
This comparison turns monitoring from a passive graph into a management tool.
Use the data to refine irrigation, not just trigger it
A simple threshold can be useful, especially once the soil and crop response are well understood. But many farms get more value by using trends to refine irrigation strategy.
Soil moisture data can support decisions such as:
When to start the next irrigation
Whether the last irrigation was long enough
Whether water reached the target depth
Whether the interval between irrigations is too short or too long
Whether different blocks need different irrigation timing
Whether rainfall has genuinely reduced irrigation demand
Whether a wet lower profile suggests the need to reduce application
The trend after irrigation can be just as useful as the dry-down before it. A fast rise followed by a fast fall may show shallow wetting in a low water-holding soil. A delayed deeper response may show slow infiltration. A deeper layer that stays wet for too long may suggest restricted drainage or over-application.
As the season progresses, the dry-down slope often changes. Larger canopies and warmer weather can increase water use. A crop under stress may use less water than expected. A sudden change in the slope can lead to a useful field check.
Soil moisture data should support judgement, not replace it. Walk the crop. Check the irrigation system. Look at the forecast. Compare zones. The sensor gives a steady view below the surface, but it cannot see every cause.
Understand what electrical conductivity can and cannot tell you
Some soil monitoring options include electrical conductivity, often shortened to EC. EC readings can be useful, but they need careful interpretation.
In broad terms, EC relates to how well the soil solution conducts electricity. That can be influenced by salts, water content, soil texture, fertiliser, temperature, and the measurement method. A change in EC after fertigation or irrigation may be meaningful, but it should not be treated as a simple salinity answer without context.
Where EC is provided, consider:
The soil type and normal background readings
Recent irrigation and rainfall
Fertiliser or fertigation events
Soil moisture level at the time of reading
The sensor’s measurement method
Whether the value is suitable for trend comparison or needs further testing
If salinity management is important, soil or water testing through appropriate methods may be needed to confirm what the sensor trend suggests. The sensor data can point to changes and patterns, but interpretation should match the crop, soil, and measurement approach.
Select monitoring hardware for the site conditions
The monitoring device needs to suit the field, not just the data wish list.
Dragino SE01 product families include soil monitoring options with different communications and power arrangements. When comparing options, confirm the details for the selected model rather than assuming every version measures the same things or suits the same environment.
Check the following before installation:
Which measurements the selected probe provides
Supported communications method and expected coverage at the site
Power arrangement and maintenance needs
Probe length, depth options, and installation method
Environmental limits
Suitability for the crop, soil, and irrigation layout
Data access and logging interval
Requirements for mounting, cabling, and protection from machinery or livestock
Communications deserve special attention. A sensor in the right agronomic location still needs to report reliably. Low areas, tree cover, distance from gateways, terrain, and enclosure placement can affect signal performance. The best layout balances agronomic value with practical connectivity, without letting connectivity alone dictate the monitoring point.
Power is similar. Battery, solar, and other arrangements can all work well when matched to the site. The key is to understand maintenance needs before the season is under pressure.
You can review Dragino soil monitoring options through ProSense’s Dragino range and confirm model details against the conditions in the field.
Turn monitoring into a seasonal routine
Soil moisture monitoring works best when someone reviews the trends often enough to connect them with field events. A weekly glance may not be enough during fast crop growth or hot weather. Daily review may be useful during peak demand, irrigation changes, or after installation.
A practical routine can be simple:
Check that data is updating.
Compare the trend with the most recent irrigation and rainfall.
Look at shallow and deeper responses.
Note whether dry-down is faster or slower than expected.
Check the forecast before making timing changes.
Inspect the field if the data does not match expectations.
Record any system changes, crop stages, or unusual events.
Over time, the record becomes a reference for future decisions. It can show which blocks dry quickly, which soils hold water longer, and which irrigation sets need adjustment. It can also support conversations between growers, agronomists, irrigation managers, and service providers because everyone can discuss the same trend.
The goal is not perfect data. The goal is better decisions made earlier, with less guesswork.
Soil moisture monitoring earns its place when the sensor represents the crop’s root zone, the installation gives reliable contact, and the data is read beside weather and irrigation activity. Start with management zones, choose depths that match root water use, and treat each graph as part of the field story. Better irrigation decisions come from seeing both the numbers and the paddock they are meant to describe.


